Pele · prose, tables and diagrams
Compare the same data across eighteen recipes and forty-seven states, with six portrait web studies. Examine the contributions of diagram syntax, statistical calculation, authored SVG and HTML.
For people making research, teaching and web content with prose, tables and diagrams · 2026.10.20
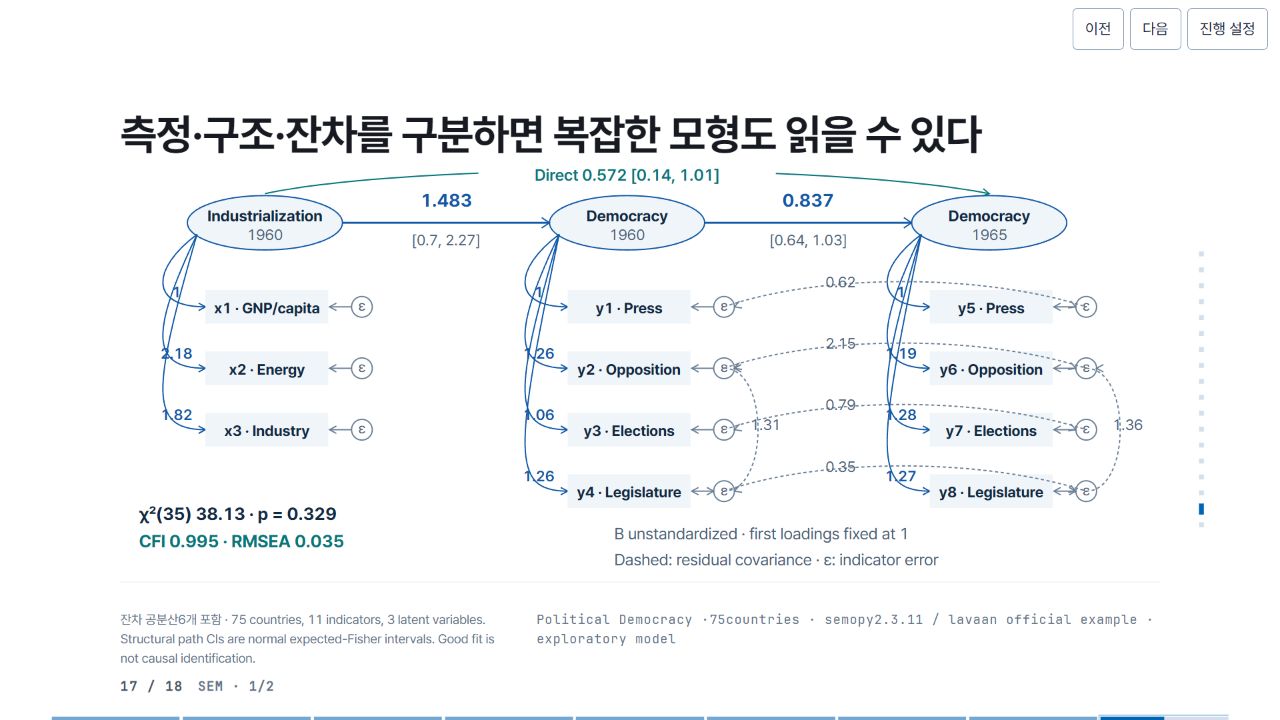
A production study of how the same material reads in different environments. Research briefs, methods, statistical findings, evidence reviews, teaching guides and a dense single infographic are available in web reading and portrait views. The original eighteen recipes retain forty-seven states; four states currently use native Pele numeric marks, with authored SVG states clearly identified. Poster and print examples belong in the poster skill repository.
What this project covers
- Compare eighteen existing recipes with new representations while preserving the same data and states.
- Explore the reading order of prose, tables and diagrams in six portrait web studies.
- Distinguish the roles and verification scope of Pele, authored SVG, calculation and HTML.
Resources
- Atlas · web and portrait views ↗ LINK · 0.8.0-review
- Eighteen social-science slides and production code ↗ LINK · 1.0.0
- Poster skill and print examples ↗ LINK · 1.3.0-rc.1 candidate