High-density social science visualization with Pele
Nine analysis families, 18 presentation slides. Explore Pele relationship maps alongside precision SVG statistical graphics and the actual code behind each example.
Researchers, educators and developers presenting research or reusing visualization code · 2026.10.20
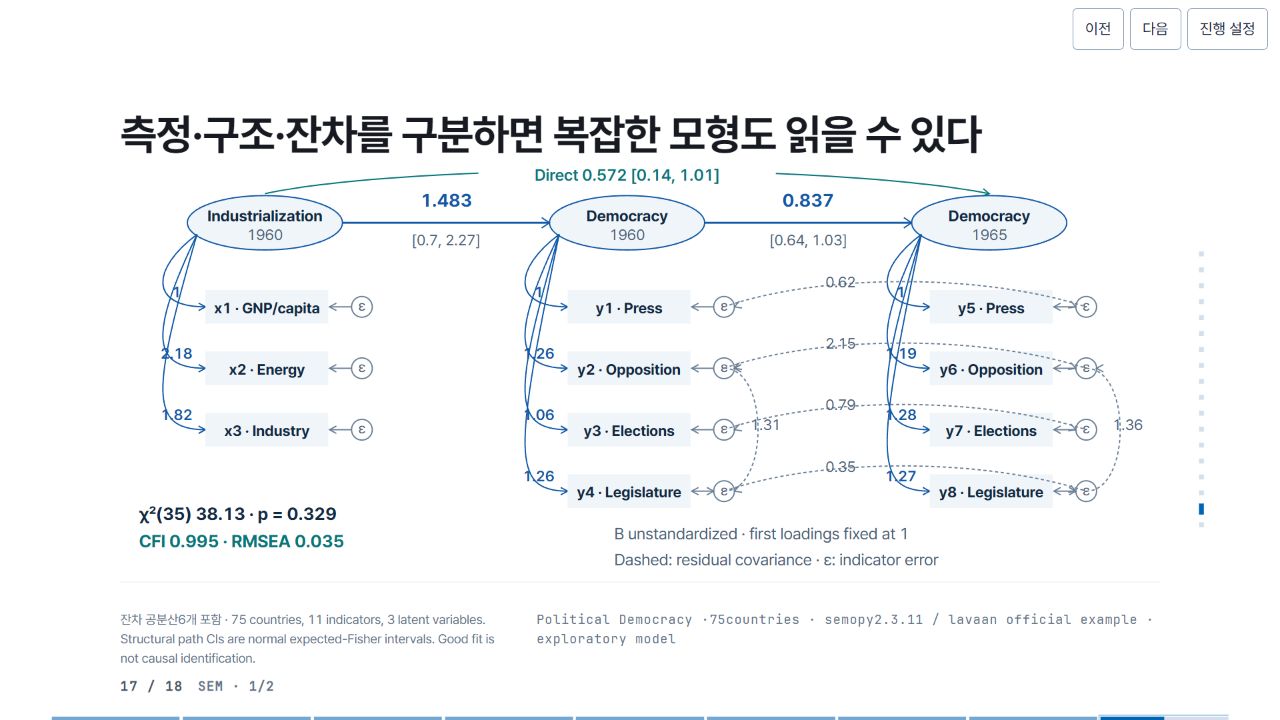
Eighteen slides cover chi-square, t tests, correlation, regression, ANOVA, two-way ANOVA, moderation, mediation and structural equation models. This production experiment preserves estimates and uncertainty from public datasets.
From result to code, one slide at a time.
Pele is a lightweight open-source library rendering Mermaid syntax as themeable SVG. This demo uses Pele for relationship maps and separately authored SVG for statistical charts.
Chi-square t tests Correlation Regression One-way ANOVA Two-way ANOVA Moderation Mediation Structural equation models
Code behind each slide What this project covers
- Read estimates, confidence intervals and model conditions on one slide.
- Distinguish Pele relationship maps from separately authored SVG charts.
- Inspect and copy source and production code for each of the 18 slides.
Resources
- View slides · 18 original slides ↗ HTML · 1.0.0
- Code behind each slide ↗ LINK · 1.0.0
- View dark slides ↗ HTML · 1.0.0