An indirect model association does not establish causal mediation
Retain a, b, direct paths and indirect-association intervals. Monte Carlo uses parametric draws; it is neither a nonparametric bootstrap nor proof of causality.
Monte Carlo intervals · 75 countries · Political Democracy
01 · The presentation slide
CMDS · SVG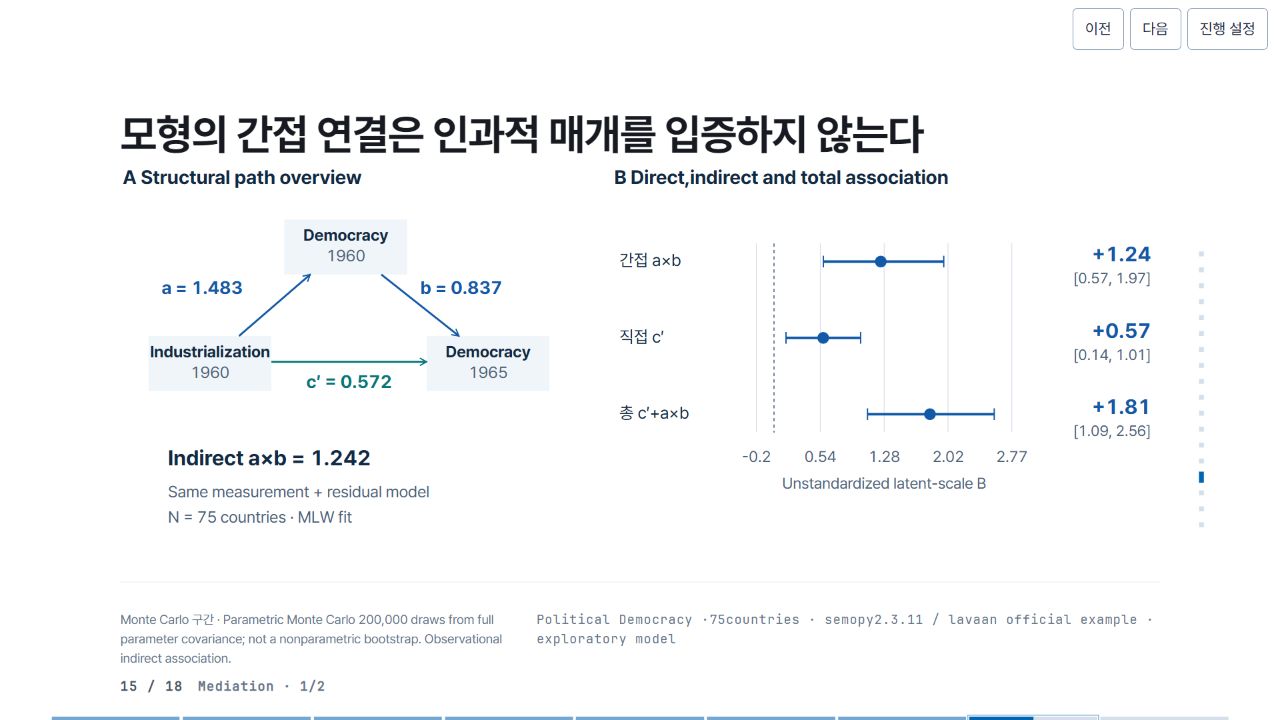
02 · Pele relationship map and source
Pele 1.6.0 · Mermaid flowchartThis companion diagram explains variables, design and tests. It is distinct from the statistical figure in the standalone presentation.

Pele map source
flowchart LR
 I["Industrialization1960"] -->|"a 1.483"| M["Democracy1960"]
 M -->|"b 0.837"| Y["Democracy1965"]
 I -->|"c direct 0.572"| Y
03 · Precision SVG construction code
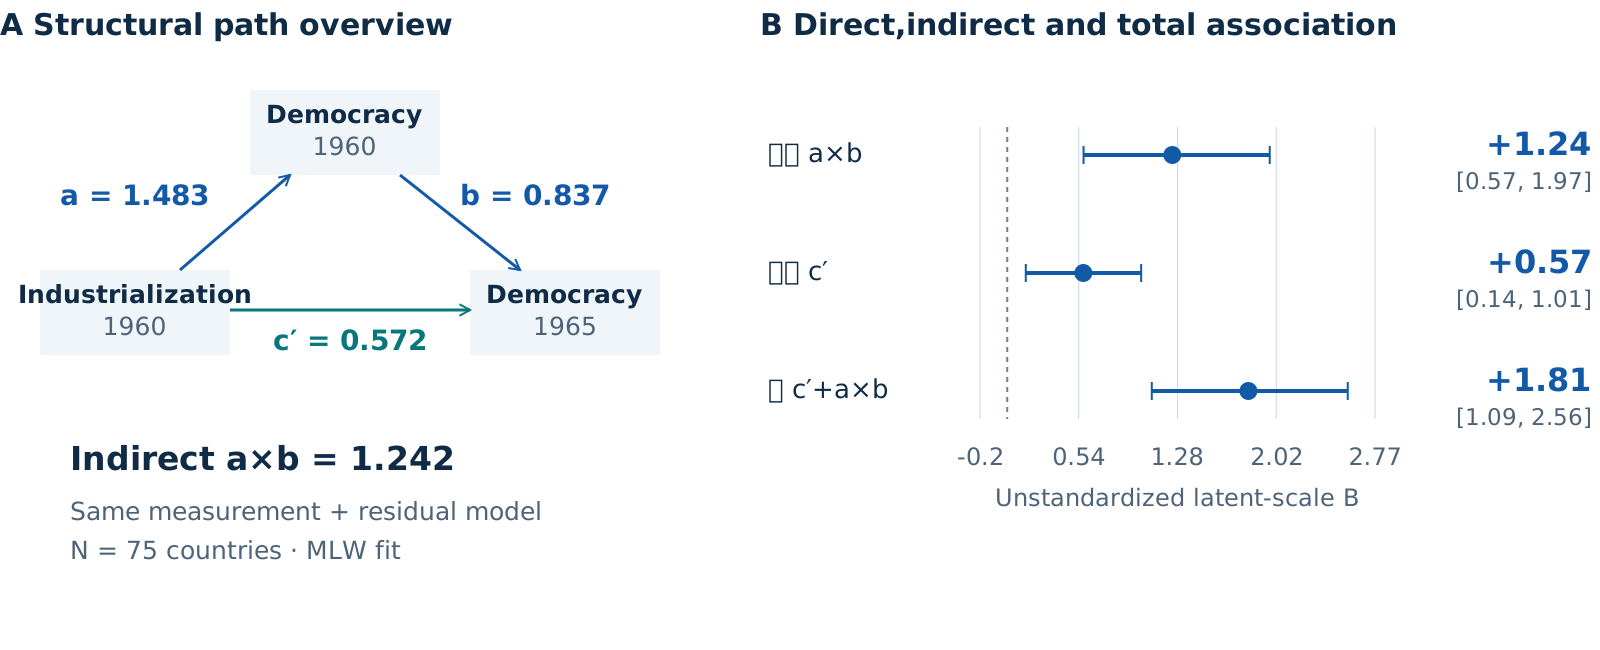
JavaScript → SVGThis actual production branch takes computed estimates and places axes, lines, intervals and labels. Shared helpers and the complete file are available below.
SVG construction branch · JavaScript
if (v.kind === "mediation") {
  a.push(
    T(0, 35, "A  Structural path overview", 30, C.ink, 700),
    T(760, 35, "B  Direct,indirect and total association", 30, C.ink, 700),
  );
  const boxes = [
    [40, 270, "Industrialization", "1960"],
    [250, 90, "Democracy", "1960"],
    [470, 270, "Democracy", "1965"],
  ];
  boxes.forEach(([x, y, s, t]) =>
    a.push(
      R(x, y, 190, 85, C.wash),
      T(x + 95, y + 33, s, 25, C.ink, 650, "middle"),
      T(x + 95, y + 65, t, 25, C.muted, 400, "middle"),
    ),
  );
  a.push(
    D("M180 270 L290 175", C.blue, 3),
    AH(290, 175, -41),
    D("M400 175 L520 270", C.blue, 3),
    AH(520, 270, 38),
    D("M230 310 L470 310", C.teal, 3),
    AH(470, 310, 0, C.teal),
    T(60, 205, "a = " + fmt(v.a, 3), 28, C.blue, 650),
    T(460, 205, "b = " + fmt(v.b, 3), 28, C.blue, 650),
    T(350, 350, "c′ = " + fmt(v.c, 3), 28, C.teal, 650, "middle"),
    T(70, 470, "Indirect a×b = " + fmt(v.a * v.b, 3), 33, C.ink, 700),
    T(70, 520, "Same measurement + residual model", 25, C.muted),
    T(70, 559, "N = 75 countries · MLW fit", 25, C.muted),
    ...forest(v.effects, {
      x: 760,
      y: 60,
      w: 840,
      labelW: 220,
      rowH: 118,
      title: "",
      unit: "Unstandardized latent-scale B",
    }),
  );
  note =
    v.id === "med-mc"
      ? "Parametric Monte Carlo 200,000 draws from full parameter covariance; not a nonparametric bootstrap. Observational indirect association."
      : "First-order delta normal intervals retain cross-parameter covariance. Path direction is model structure,not causal proof.";
  source =
    'flowchart LR\n I["Industrialization1960"] -->|"a ' +
    fmt(v.a, 3) +
    '"| M["Democracy1960"]\n M -->|"b ' +
    fmt(v.b, 3) +
    '"| Y["Democracy1965"]\n I -->|"c direct ' +
    fmt(v.c, 3) +
    '"| Y';
  map = { I: v.effects[0].key, M: v.effects[0].key, Y: v.effects[1].key };
}
This is preserved reference code, not an executable editor.
04 · What to change when reusing it
DATA · DESIGN · INFERENCE- Data
- Inspect the condition data first. Replace sample, units, coefficients and confidence intervals together. Do not combine different samples or measurement levels on one scale.
- Graphic
- Fit axis ranges, label widths, type and colors to the target region. Preserve whether intervals include zero and recheck legibility at the final size.
- Interpretation
- Diagram arrows and model paths are not causal evidence. Distinguish mean-response from prediction intervals, and pointwise from simultaneous intervals.