Separate structural paths, measurement and residuals
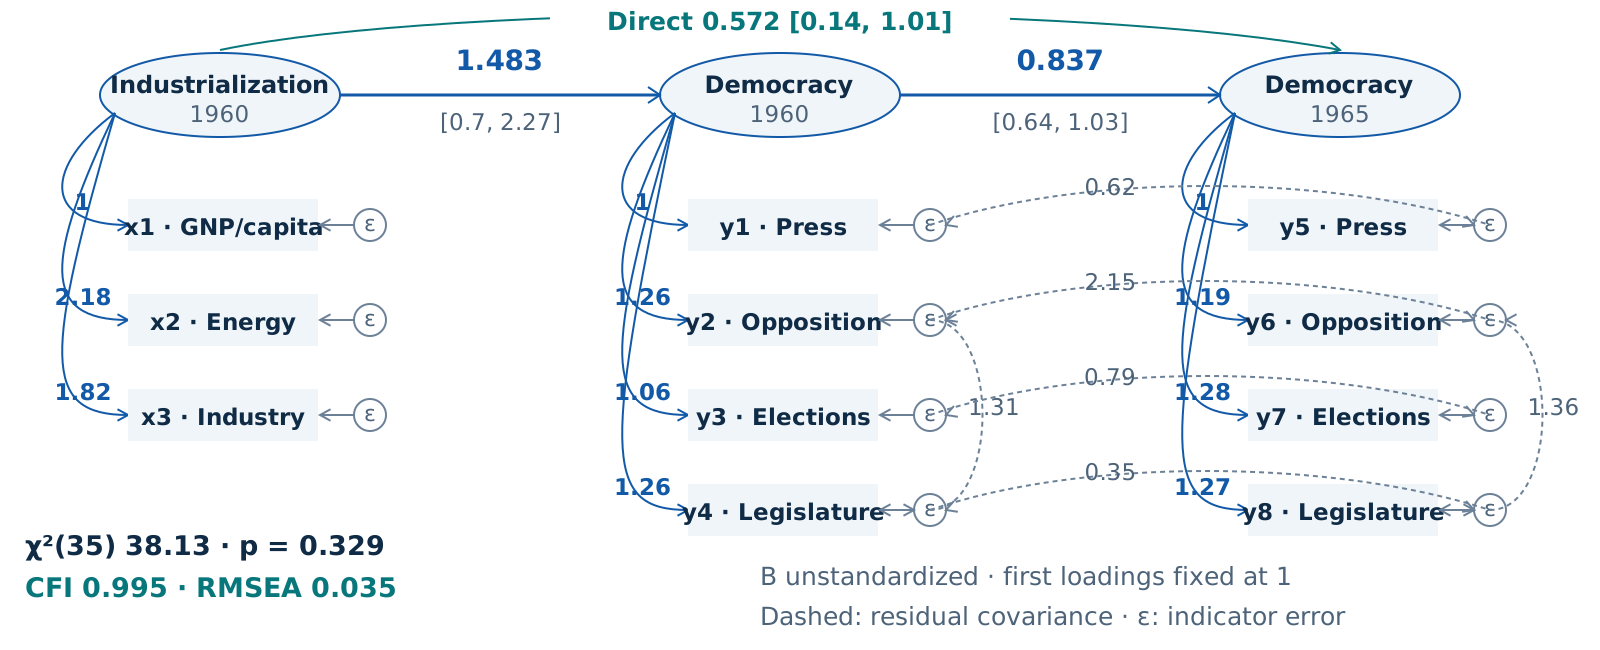
Separate latent variables, 11 indicators, structural paths, residual covariance and model fit. The 75-country sample is distinct from the ANES respondent sample.
Six residual covariances included · 75 countries · Political Democracy
01 · The presentation slide
CMDS · SVG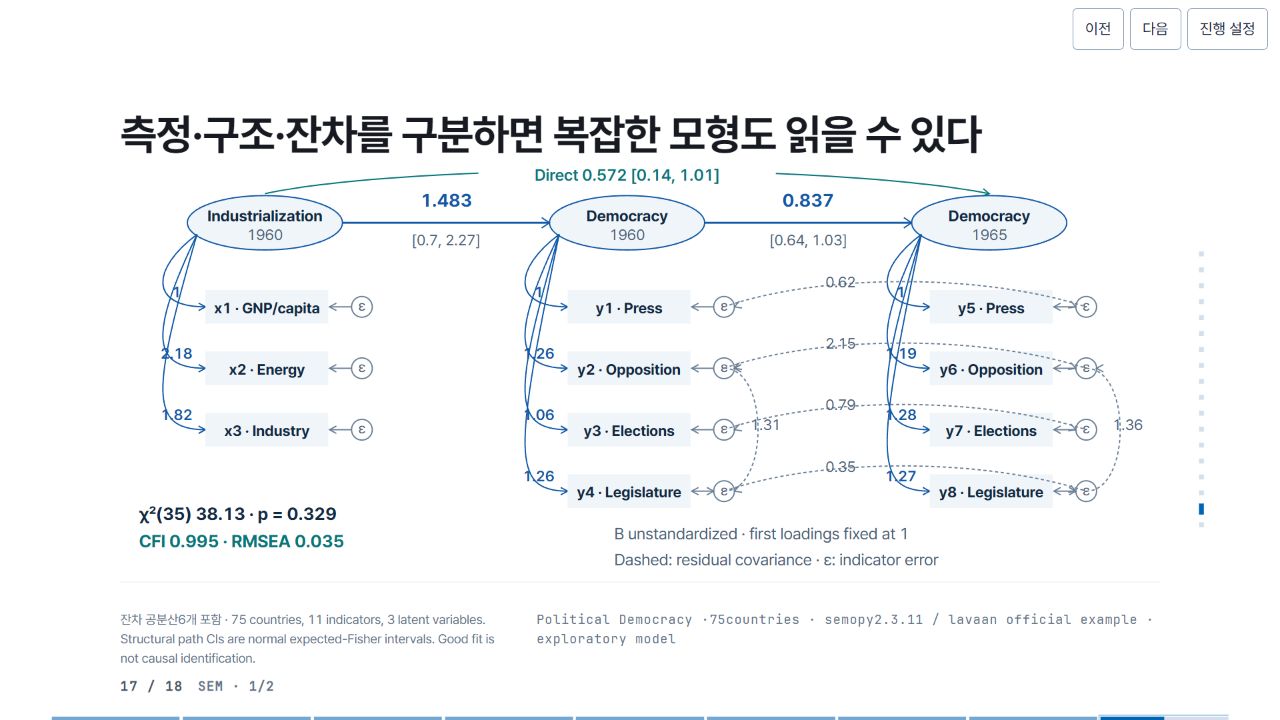
02 · Pele relationship map and source
Pele 1.6.0 · Mermaid flowchartThis companion diagram explains variables, design and tests. It is distinct from the statistical figure in the standalone presentation.

Pele map source
flowchart LR
 I(["Industrialization1960"]) --> D(["Democracy1960"])
 D --> Y(["Democracy1965"])
 I --> Y
 X["x1 x2 x3"] --- I
 A["y1 y2 y3 y4"] --- D
 B["y5 y6 y7 y8"] --- Y
03 · Precision SVG construction code
JavaScript → SVGThis actual production branch takes computed estimates and places axes, lines, intervals and labels. Shared helpers and the complete file are available below.
SVG construction branch · JavaScript
if (v.kind === "sem") {
  const latent = ["ind60", "dem60", "dem65"],
    centers = [220, 780, 1340],
    indicators = [
      ["x1", "x2", "x3"],
      ["y1", "y2", "y3", "y4"],
      ["y5", "y6", "y7", "y8"],
    ],
    pos = {},
    find = (l, r, op = "~") =>
      v.params.find((p) => p.lval === l && p.rval === r && p.op === op);
  // Residual nodes make covariance distinct from covariance of observed variables.
  latent.forEach((l, k) => {
    let x = centers[k];
    a.push(
      node("ellipse", {
        cx: x,
        cy: 95,
        rx: 120,
        ry: 42,
        fill: C.wash,
        stroke: C.blue,
        "stroke-width": 2,
      }),
      T(
        x,
        93,
        l === "ind60" ? "Industrialization" : "Democracy",
        24,
        C.ink,
        700,
        "middle",
      ),
      T(x, 122, l === "dem65" ? "1965" : "1960", 23, C.muted, 400, "middle"),
    );
    indicators[k].forEach((name, j) => {
      let yy = 225 + j * 95;
      pos[name] = { x: x + 150, y: yy };
      let e = find(name, l);
      a.push(
        G(
          [
            D(
              "M" +
                (x - 105) +
                " 113 C" +
                (x - 175) +
                " " +
                (yy - 60) +
                " " +
                (x - 180) +
                " " +
                yy +
                " " +
                (x - 92) +
                " " +
                yy,
              C.blue,
              2,
            ),
            AH(x - 92, yy, 0),
            R(x - 92, yy - 26, 190, 52, C.wash),
            T(
              x + 3,
              yy + 10,
              name +
                " · " +
                {
                  x1: "GNP/capita",
                  x2: "Energy",
                  x3: "Industry",
                  y1: "Press",
                  y2: "Opposition",
                  y3: "Elections",
                  y4: "Legislature",
                  y5: "Press",
                  y6: "Opposition",
                  y7: "Elections",
                  y8: "Legislature",
                }[name],
              23,
              C.ink,
              650,
              "middle",
            ),
            T(x - 137, yy - 15, fmt(e.b, 2), 23, C.blue, 600, "middle"),
            Q(x + 150, yy, 16, C.paper, C.slate),
            T(x + 150, yy + 6, "ε", 22, C.muted, 400, "middle"),
            L(x + 134, yy, x + 100, yy, C.slate, 2),
            AH(x + 100, yy, 180, C.slate),
          ],
          e.key,
        ),
      );
    });
  });
  for (const [l, r, start, end] of [
    ["dem60", "ind60", 340, 660],
    ["dem65", "dem60", 900, 1220],
  ]) {
    let e = find(l, r);
    a.push(
      G(
        [
          L(start, 95, end, 95, C.blue, 3),
          D(
            "M" + (end - 12) + " 87 L" + end + " 95 L" + (end - 12) + " 103",
            C.blue,
            2,
          ),
          T((start + end) / 2, 70, fmt(e.b, 3), 28, C.blue, 700, "middle"),
          T(
            (start + end) / 2,
            130,
            "[" + e.ci.map((x) => fmt(x, 2)).join(", ") + "]",
            23,
            C.muted,
            400,
            "middle",
          ),
        ],
        e.key,
      ),
    );
  }
  let direct = find("dem65", "ind60");
  a.push(
    G(
      [
        D("M220 50 C450 2 1090 2 1340 50", C.teal, 2),
        AH(1340, 50, 11, C.teal),
        R(550, 4, 460, 32, C.paper),
        T(
          780,
          30,
          "Direct " +
            fmt(direct.b, 3) +
            " [" +
            direct.ci.map((x) => fmt(x, 2)).join(", ") +
            "]",
          25,
          C.teal,
          600,
          "middle",
        ),
      ],
      direct.key,
    ),
  );
  if (v.id === "sem-full")
    for (const [u, w] of [
      ["y1", "y5"],
      ["y2", "y4"],
      ["y2", "y6"],
      ["y3", "y7"],
      ["y4", "y8"],
      ["y6", "y8"],
    ]) {
      let e = v.params.find(
          (p) =>
            p.op === "~~" &&
            ((p.lval === u && p.rval === w) || (p.lval === w && p.rval === u)),
        ),
        s = pos[u],
        t = pos[w];
      if (!e) throw Error("missing covariance " + u + w);
      let d =
        s.x === t.x
          ? "M" +
            s.x +
            " " +
            s.y +
            " C" +
            (s.x + 70) +
            " " +
            s.y +
            " " +
            (t.x + 70) +
            " " +
            t.y +
            " " +
            t.x +
            " " +
            t.y
          : "M" +
            s.x +
            " " +
            s.y +
            " C" +
            (s.x + 150) +
            " " +
            (s.y - 52) +
            " " +
            (t.x - 160) +
            " " +
            (t.y - 52) +
            " " +
            t.x +
            " " +
            t.y;
      let tx = s.x === t.x ? s.x + 64 : (s.x + t.x) / 2 - 100,
        ty = s.x === t.x ? (s.y + t.y) / 2 : s.y - 30;
      a.push(
        G(
          [
            D(d, C.slate, 2, "none", { "stroke-dasharray": "5 4" }),
            AH(s.x + 16, s.y, s.x === t.x ? 180 : 160, C.slate),
            AH(t.x - 16, t.y, s.x === t.x ? 0 : 20, C.slate),
            T(tx, ty, fmt(e.b, 2), 23, C.muted, 400, "middle"),
          ],
          e.key,
        ),
      );
    }
  a.push(
    T(
      25,
      555,
      "χ²(" + v.fit.DoF + ") " + fmt(v.fit.chi2, 2) + " · " + pv(v.fit["chi2 p-value"]),
      27,
      C.ink,
      650,
    ),
    T(
      25,
      597,
      "CFI " + fmt(v.fit.CFI, 3) + " · RMSEA " + fmt(v.fit.RMSEA, 3),
      27,
      C.teal,
      700,
    ),
    T(760, 585, "B unstandardized · first loadings fixed at 1", 25, C.muted),
    T(760, 625, "Dashed: residual covariance · ε: indicator error", 25, C.muted),
  );
  note =
    "75 countries, 11 indicators, 3 latent variables. Structural path CIs are normal expected-Fisher intervals. Good fit is not causal identification.";
  source =
    'flowchart LR\n I(["Industrialization1960"]) --> D(["Democracy1960"])\n D --> Y(["Democracy1965"])\n I --> Y\n X["x1 x2 x3"] --- I\n A["y1 y2 y3 y4"] --- D\n B["y5 y6 y7 y8"] --- Y';
  map = {
    I: v.key,
    D: v.key,
    Y: v.key,
    X: find("x2", "ind60").key,
    A: find("y2", "dem60").key,
    B: find("y6", "dem65").key,
  };
}
This is preserved reference code, not an executable editor.
04 · What to change when reusing it
DATA · DESIGN · INFERENCE- Data
- Inspect the condition data first. Replace sample, units, coefficients and confidence intervals together. Do not combine different samples or measurement levels on one scale.
- Graphic
- Fit axis ranges, label widths, type and colors to the target region. Preserve whether intervals include zero and recheck legibility at the final size.
- Interpretation
- Diagram arrows and model paths are not causal evidence. Distinguish mean-response from prediction intervals, and pointwise from simultaneous intervals.