잔차 공분산을 생략하면 같은 자료의 적합도가 달라진다
잠재변수·11개 측정지표·구조경로·잔차 공분산과 적합도를 분리합니다. 75개 국가 표본은 ANES 응답자 표본과 다릅니다.
잔차 공분산 생략 · 75 countries · Political Democracy
01 · 실제 발표 장표
CMDS · SVG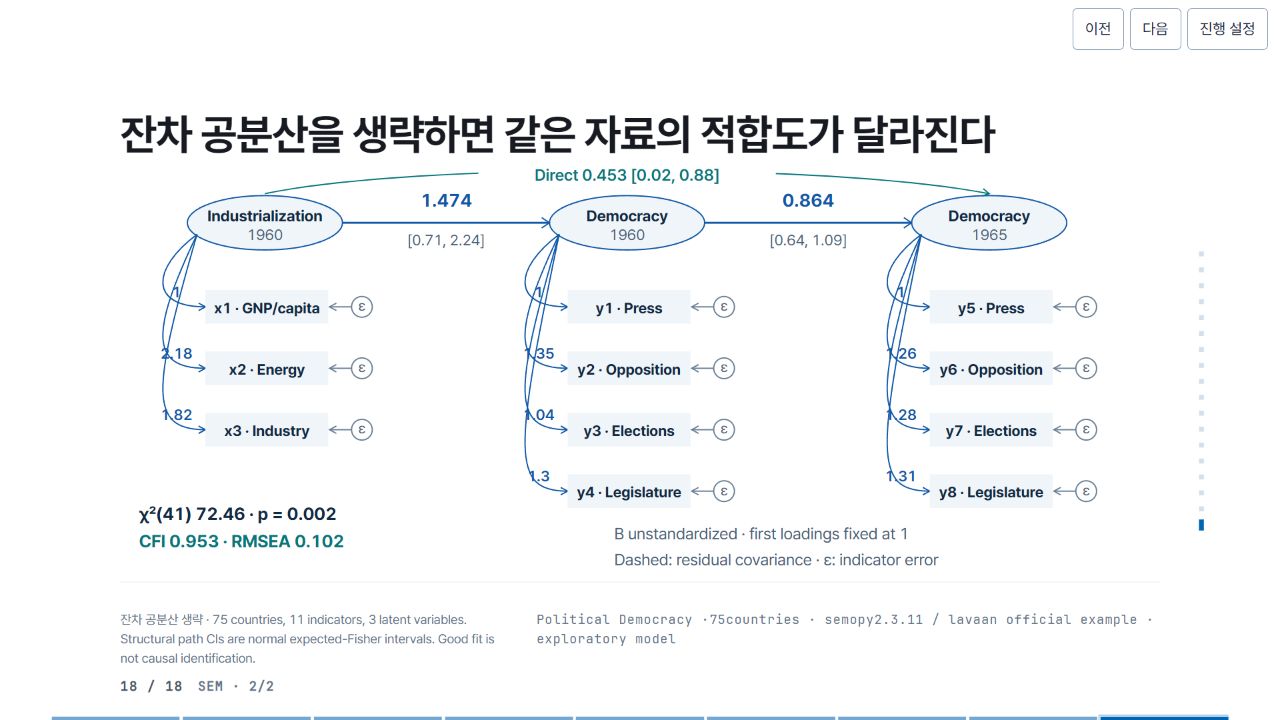
02 · Pele 관계도와 원문
Pele 1.6.0 · Mermaid flowchart이 관계도는 분석의 변수·설계·검정 관계를 설명하는 보조 도식입니다. 단독 HTML 발표 장표의 통계 그림과 구분합니다.

Pele 관계도 원문
flowchart LR
 I(["Industrialization1960"]) --> D(["Democracy1960"])
 D --> Y(["Democracy1965"])
 I --> Y
 X["x1 x2 x3"] --- I
 A["y1 y2 y3 y4"] --- D
 B["y5 y6 y7 y8"] --- Y
03 · 정밀 SVG 제작 코드
JavaScript → SVG공개된 추정치를 받아 축·선·구간·라벨을 직접 배치하는 실제 제작 분기입니다. 생략한 공용 함수와 전체 파일도 확인할 수 있습니다.
SVG 제작 분기 · JavaScript
if (v.kind === "sem") {
  const latent = ["ind60", "dem60", "dem65"],
    centers = [220, 780, 1340],
    indicators = [
      ["x1", "x2", "x3"],
      ["y1", "y2", "y3", "y4"],
      ["y5", "y6", "y7", "y8"],
    ],
    pos = {},
    find = (l, r, op = "~") =>
      v.params.find((p) => p.lval === l && p.rval === r && p.op === op);
  // Residual nodes make covariance distinct from covariance of observed variables.
  latent.forEach((l, k) => {
    let x = centers[k];
    a.push(
      node("ellipse", {
        cx: x,
        cy: 95,
        rx: 120,
        ry: 42,
        fill: C.wash,
        stroke: C.blue,
        "stroke-width": 2,
      }),
      T(
        x,
        93,
        l === "ind60" ? "Industrialization" : "Democracy",
        24,
        C.ink,
        700,
        "middle",
      ),
      T(x, 122, l === "dem65" ? "1965" : "1960", 23, C.muted, 400, "middle"),
    );
    indicators[k].forEach((name, j) => {
      let yy = 225 + j * 95;
      pos[name] = { x: x + 150, y: yy };
      let e = find(name, l);
      a.push(
        G(
          [
            D(
              "M" +
                (x - 105) +
                " 113 C" +
                (x - 175) +
                " " +
                (yy - 60) +
                " " +
                (x - 180) +
                " " +
                yy +
                " " +
                (x - 92) +
                " " +
                yy,
              C.blue,
              2,
            ),
            AH(x - 92, yy, 0),
            R(x - 92, yy - 26, 190, 52, C.wash),
            T(
              x + 3,
              yy + 10,
              name +
                " · " +
                {
                  x1: "GNP/capita",
                  x2: "Energy",
                  x3: "Industry",
                  y1: "Press",
                  y2: "Opposition",
                  y3: "Elections",
                  y4: "Legislature",
                  y5: "Press",
                  y6: "Opposition",
                  y7: "Elections",
                  y8: "Legislature",
                }[name],
              23,
              C.ink,
              650,
              "middle",
            ),
            T(x - 137, yy - 15, fmt(e.b, 2), 23, C.blue, 600, "middle"),
            Q(x + 150, yy, 16, C.paper, C.slate),
            T(x + 150, yy + 6, "ε", 22, C.muted, 400, "middle"),
            L(x + 134, yy, x + 100, yy, C.slate, 2),
            AH(x + 100, yy, 180, C.slate),
          ],
          e.key,
        ),
      );
    });
  });
  for (const [l, r, start, end] of [
    ["dem60", "ind60", 340, 660],
    ["dem65", "dem60", 900, 1220],
  ]) {
    let e = find(l, r);
    a.push(
      G(
        [
          L(start, 95, end, 95, C.blue, 3),
          D(
            "M" + (end - 12) + " 87 L" + end + " 95 L" + (end - 12) + " 103",
            C.blue,
            2,
          ),
          T((start + end) / 2, 70, fmt(e.b, 3), 28, C.blue, 700, "middle"),
          T(
            (start + end) / 2,
            130,
            "[" + e.ci.map((x) => fmt(x, 2)).join(", ") + "]",
            23,
            C.muted,
            400,
            "middle",
          ),
        ],
        e.key,
      ),
    );
  }
  let direct = find("dem65", "ind60");
  a.push(
    G(
      [
        D("M220 50 C450 2 1090 2 1340 50", C.teal, 2),
        AH(1340, 50, 11, C.teal),
        R(550, 4, 460, 32, C.paper),
        T(
          780,
          30,
          "Direct " +
            fmt(direct.b, 3) +
            " [" +
            direct.ci.map((x) => fmt(x, 2)).join(", ") +
            "]",
          25,
          C.teal,
          600,
          "middle",
        ),
      ],
      direct.key,
    ),
  );
  if (v.id === "sem-full")
    for (const [u, w] of [
      ["y1", "y5"],
      ["y2", "y4"],
      ["y2", "y6"],
      ["y3", "y7"],
      ["y4", "y8"],
      ["y6", "y8"],
    ]) {
      let e = v.params.find(
          (p) =>
            p.op === "~~" &&
            ((p.lval === u && p.rval === w) || (p.lval === w && p.rval === u)),
        ),
        s = pos[u],
        t = pos[w];
      if (!e) throw Error("missing covariance " + u + w);
      let d =
        s.x === t.x
          ? "M" +
            s.x +
            " " +
            s.y +
            " C" +
            (s.x + 70) +
            " " +
            s.y +
            " " +
            (t.x + 70) +
            " " +
            t.y +
            " " +
            t.x +
            " " +
            t.y
          : "M" +
            s.x +
            " " +
            s.y +
            " C" +
            (s.x + 150) +
            " " +
            (s.y - 52) +
            " " +
            (t.x - 160) +
            " " +
            (t.y - 52) +
            " " +
            t.x +
            " " +
            t.y;
      let tx = s.x === t.x ? s.x + 64 : (s.x + t.x) / 2 - 100,
        ty = s.x === t.x ? (s.y + t.y) / 2 : s.y - 30;
      a.push(
        G(
          [
            D(d, C.slate, 2, "none", { "stroke-dasharray": "5 4" }),
            AH(s.x + 16, s.y, s.x === t.x ? 180 : 160, C.slate),
            AH(t.x - 16, t.y, s.x === t.x ? 0 : 20, C.slate),
            T(tx, ty, fmt(e.b, 2), 23, C.muted, 400, "middle"),
          ],
          e.key,
        ),
      );
    }
  a.push(
    T(
      25,
      555,
      "χ²(" + v.fit.DoF + ") " + fmt(v.fit.chi2, 2) + " · " + pv(v.fit["chi2 p-value"]),
      27,
      C.ink,
      650,
    ),
    T(
      25,
      597,
      "CFI " + fmt(v.fit.CFI, 3) + " · RMSEA " + fmt(v.fit.RMSEA, 3),
      27,
      C.teal,
      700,
    ),
    T(760, 585, "B unstandardized · first loadings fixed at 1", 25, C.muted),
    T(760, 625, "Dashed: residual covariance · ε: indicator error", 25, C.muted),
  );
  note =
    "75 countries, 11 indicators, 3 latent variables. Structural path CIs are normal expected-Fisher intervals. Good fit is not causal identification.";
  source =
    'flowchart LR\n I(["Industrialization1960"]) --> D(["Democracy1960"])\n D --> Y(["Democracy1965"])\n I --> Y\n X["x1 x2 x3"] --- I\n A["y1 y2 y3 y4"] --- D\n B["y5 y6 y7 y8"] --- Y';
  map = {
    I: v.key,
    D: v.key,
    Y: v.key,
    X: find("x2", "ind60").key,
    A: find("y2", "dem60").key,
    B: find("y6", "dem65").key,
  };
}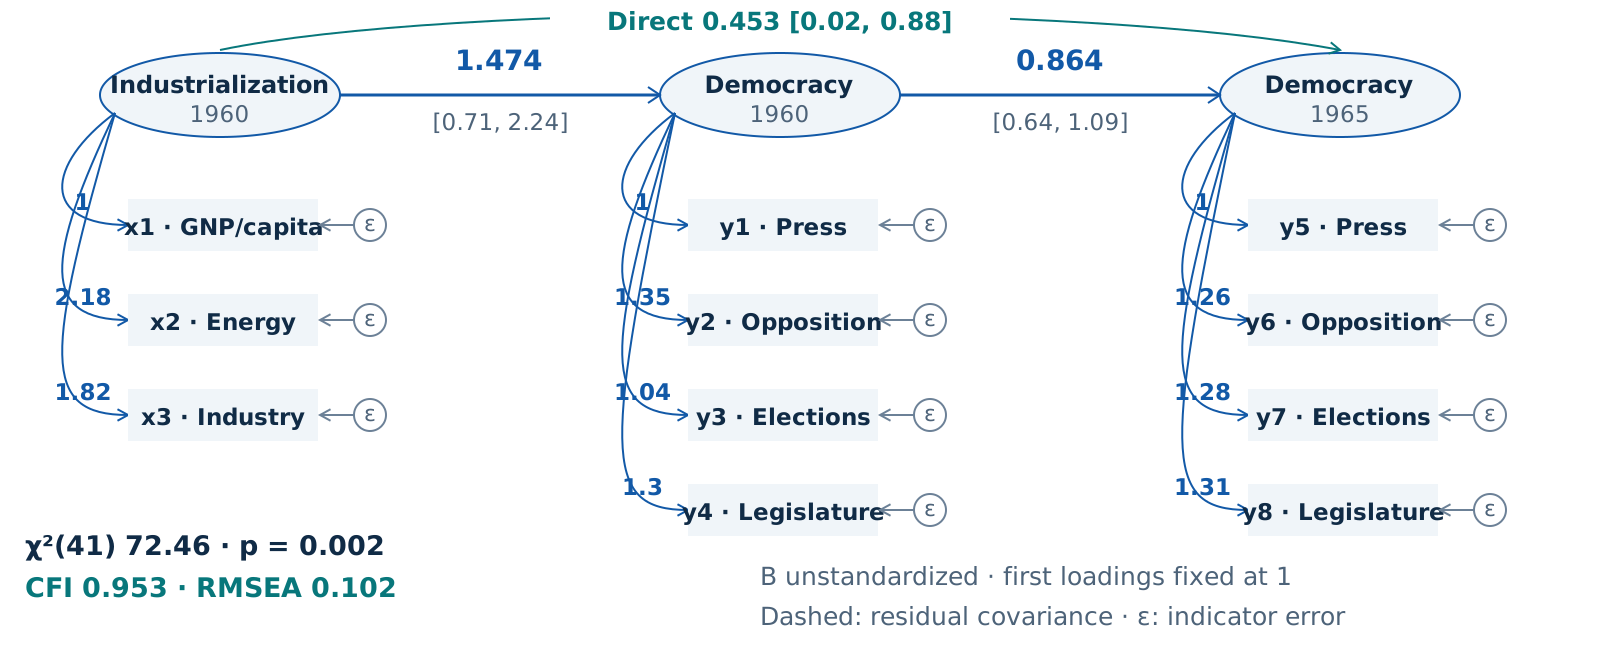
이 소스는 실행 가능한 편집기가 아니라 원문을 보존한 참고 코드입니다.
04 · 재사용할 때 바꿀 것
DATA · DESIGN · INFERENCE- 데이터
- 해당 조건의 데이터 파일을 먼저 확인하고, 표본·단위·계수·신뢰구간을 함께 교체합니다. 표본이나 측정 수준이 다른 분석을 같은 척도로 합치지 않습니다.
- 그림
- 축 범위·라벨 폭·서체·색상은 실제 삽입 영역에 맞춥니다. 신뢰구간이 0을 포함하는지에 따라 의미를 보존하고, 화면을 줄인 뒤 다시 읽어 봅니다.
- 해석
- 관계도의 화살표와 통계 모형의 경로는 인과의 증거가 아닙니다. 평균 반응의 구간과 개별 예측구간, 점별 구간과 동시 구간을 구분합니다.