Can the candies in my fist tell me about the whole box? — Foundations of descriptive and inferential statistics
What does it take to speak about the whole box (the population) from a few candies drawn with your fist (a sample)? A 77-slide lecture that has you compute the mode · median · mean and variance · standard deviation directly in R, and that carries on to the trap of the mean and the starting point of inferential statistics, which estimates a population from a sample.
Graduate students who compute means in R but still struggle to explain what changes when a sample's numbers are used to speak about a population · Hallym University Media School · Graduate Communication Research Methods II · November 10, 2026 · 2026.11.10
What this project covers
- Distinguish population · sample · parameter · statistic, and explain what descriptive and inferential statistics each do.
- Compute the mode · median · mean and variance · standard deviation in R, and examine the trap of the mean, in which extreme values pull the mean toward them.
- Understand why the standard error and confidence intervals are needed when estimating a population from sample statistics.
Presentation outline
Expand the full outline
- Read the complete lecture
- 01. 10W-1
- Supporting text from the original screen
- 02. Population and sample – a Halloween random candy and chocolate box
- Supporting text from the original screen
- 03. Let us grab some candy with our fists.
- Supporting text from the original screen
- 04. Let us grab some candy with our fists.
- Supporting text from the original screen
- 05. Population and sample
- Supporting text from the original screen
- 06. Descriptive statistics and inferential statistics
- Supporting text from the original screen
- 07. What is descriptive statistics?
- Supporting text from the original screen
- 08. Descriptive statistics
- Supporting text from the original screen
- 09. Descriptive statistics
- Supporting text from the original screen
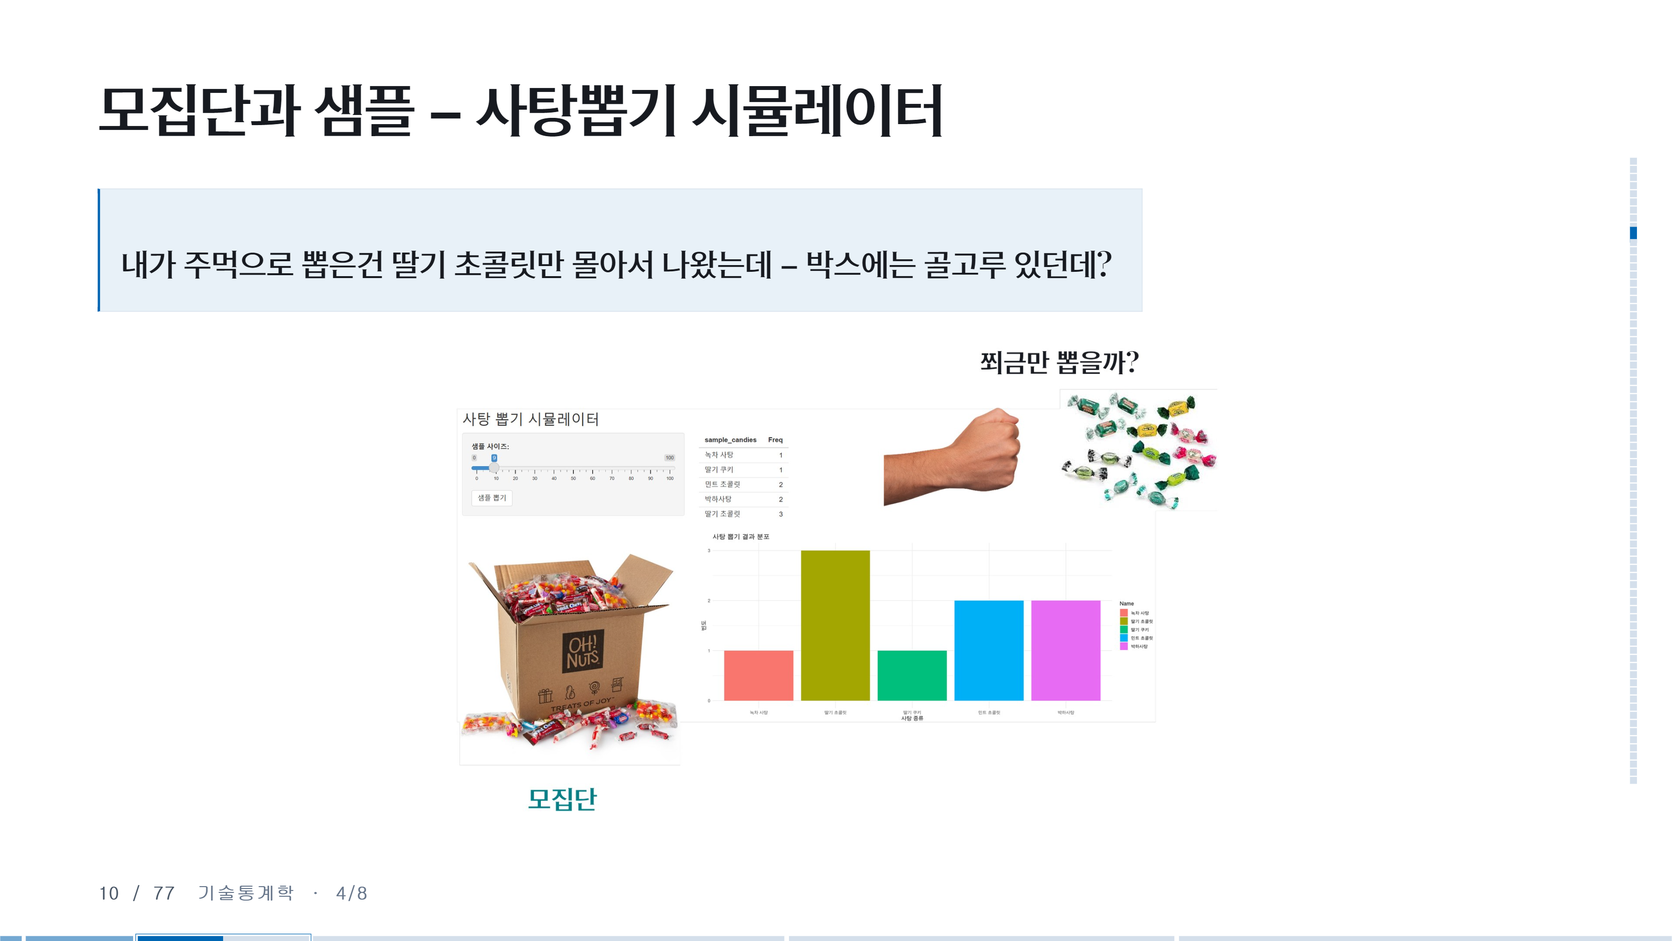
- 10. Population and sample – candy-drawing simulator
- Supporting text from the original screen
- 11. Descriptive statistics
- Supporting text from the original screen
- 12. Types and interpretation of descriptive statistics – what to use for a ‘one-line summary’
- Supporting text from the original screen
- 13. Types and interpretation of descriptive statistics
- Supporting text from the original screen
- 14. Types and interpretation of descriptive statistics
- Supporting text from the original screen
- 15. Why R?
- Supporting text from the original screen
- 16. Installing R & R-Studio
- Supporting text from the original screen
- 17. Installing R & R-Studio
- Supporting text from the original screen
- 18. Installing R & R-Studio
- Supporting text from the original screen
- 19. Installing R & R-Studio
- Supporting text from the original screen
- 20. Installing R & R-Studio
- Supporting text from the original screen
- 21. Installing R & R-Studio
- Supporting text from the original screen
- 22. Running R-Studio
- Supporting text from the original screen
- 23. Running R-Studio
- Supporting text from the original screen
- 24. Running R-Studio
- Supporting text from the original screen
- 25. Running R-Studio: Ctrl+C / Ctrl+V the following code as is
- Supporting text from the original screen
- 26. Running R-Studio: Ctrl+C / Ctrl+V the following code as is
- Supporting text from the original screen
- 27. Example data for descriptive statistics
- Supporting text from the original screen
- 28. Types and interpretation of descriptive statistics - mode
- Supporting text from the original screen
- 29. AI & R Exercise - Mode
- Supporting text from the original screen
- 30. Example data for descriptive statistics – the answer for the mode
- Supporting text from the original screen
- 31. Types and interpretation of descriptive statistics - median
- Supporting text from the original screen
- 32. AI & R Exercise - Median
- Supporting text from the original screen
- 33. Example data for descriptive statistics – the answer for the median
- Supporting text from the original screen
- 34. Types and interpretation of descriptive statistics - mean
- Supporting text from the original screen
- 35. AI & R Exercise - Mean
- Supporting text from the original screen
- 36. Example data for descriptive statistics – the answer for the mean value
- Supporting text from the original screen
- 37. The trap of the mean
- Supporting text from the original screen
- 38. Example data for descriptive statistics – the problem with the mean value: Outlier
- Supporting text from the original screen
- 39. R-Studio example 2: Ctrl+C / Ctrl+V the following code as is
- Supporting text from the original screen
- 40. R-Studio example 2: salary
- Supporting text from the original screen
- 41. AI & R Exercise - Mean
- Supporting text from the original screen
- 42. R-Studio example 2: the answer for the average salary
- Supporting text from the original screen
- 43. The trap of the mean
- Supporting text from the original screen
- 44. Median income in Korea
- Supporting text from the original screen
- 45. Trends in Korea's standard median income (by household size)
- Supporting text from the original screen
- 46. Types and interpretation of descriptive statistics
- Supporting text from the original screen
- 47. Types and interpretation of descriptive statistics
- Supporting text from the original screen
- 48. Types and interpretation of descriptive statistics
- Supporting text from the original screen
- 49. Types and interpretation of descriptive statistics
- Supporting text from the original screen
- 50. R-Studio example 2: Ctrl+C / Ctrl+V the following code as is
- Supporting text from the original screen
- 51. R-Studio example 2: distribution of the average salary with a student earning 1 billion won mixed in
- Supporting text from the original screen
- 52. R-Studio example 2: Ctrl+C / Ctrl+V the following code as is
- Supporting text from the original screen
- 53. R-Studio example 2: normal distribution plot of students with evenly spread salaries
- Supporting text from the original screen
- 54. Summary
- Supporting text from the original screen
- 55. What is inferential statistics?
- Supporting text from the original screen
- 56. What is inferential statistics?
- Supporting text from the original screen
- 57. Population and sample – how many strawberry chocolates are there in the whole box?
- Supporting text from the original screen
- 58. Let us grab some candy with our fists.
- Supporting text from the original screen
- 59. RQ. How many strawberry chocolate candies are there in total among all the original candies?
- Supporting text from the original screen
- 60. RQ. How many strawberry chocolate candies are there in total among all the original candies?
- Supporting text from the original screen
- 61. Let us count only the candies in my hand (never mind the original box)
- Supporting text from the original screen
- 62. Let us count only the candies in my hand (never mind the original box)
- Supporting text from the original screen
- 63. Candy-drawing simulator – try drawing on the web
- Supporting text from the original screen
- 64. Exercise. Let us count the number of candies and the strawberry chocolates with the candy-drawing simulator
- Supporting text from the original screen
- 65. RQ. How many strawberry chocolate candies are there in total among all the original candies?
- Supporting text from the original screen
- 66. RQ. How many strawberry chocolate candies are there in total among all the original candies?
- Supporting text from the original screen
- 67. RQ. How many strawberry chocolate candies are there in total among all the original candies?
- Supporting text from the original screen
- 68. Finding the descriptive statistics of the strawberry chocolates
- Supporting text from the original screen
- 69. Finding the descriptive statistics of the strawberry chocolates – R output
- Supporting text from the original screen
- 70. Inferential statistics: estimating the number of strawberry chocolates in the whole box
- Supporting text from the original screen
- 71. Inferential statistics: estimating the number of strawberry chocolates in the whole box
- Supporting text from the original screen
- 72. The beginning of inferential statistics: sampling and estimation
- Supporting text from the original screen
- 73. Inferential statistics: estimating the population (the candy box) from candy sample statistics
- Supporting text from the original screen
- 74. Premise 1 of inferential statistics: the population cannot be known ‘exactly’
- Supporting text from the original screen
- 75. Premise 2 of inferential statistics: there is always a chance of being wrong
- Supporting text from the original screen
- 76. Premise 3 of inferential statistics: a ‘standard error’ exists (a number that shows how wrong I am)
- Supporting text from the original screen
- 77. Summary of the basics of inferential statistics
- Supporting text from the original screen
Resources
- Lecture slides · 77 slides in Korean ↗ HTML · 1.0.0